
Investing.com, a major provider of financial news and data, has introduced a new AI chart analysis capability powered by its in-house Vision AI engine. This addition aims to significantly streamline the evaluation process for active traders, turning hours of manual chart analysis into short, actionable trading plans.
The new tool leverages the Vision AI engine to emulate a seasoned trader’s “eyes and reasoning,” according to Investing.com’s CTO, Yonatan Adest.
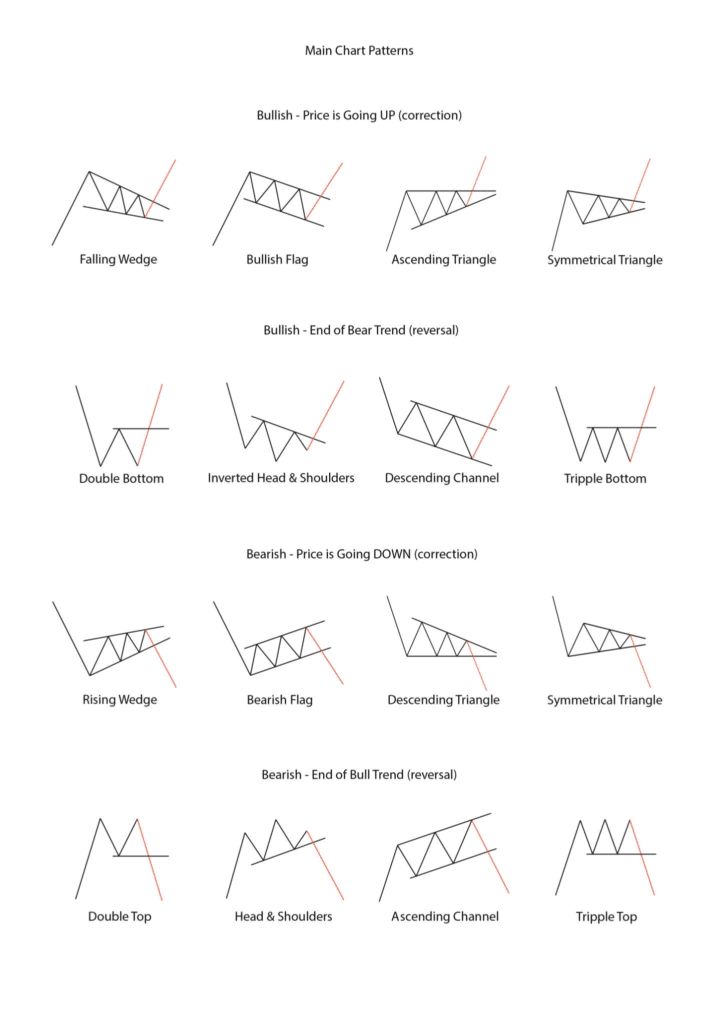
- Pattern Recognition: The AI automatically identifies complex market formations, including candlestick patterns (like Head-and-Shoulders), support and resistance levels, trend shifts, and breakouts.
- Actionable Summaries: When a user selects ‘Analyse Chart,’ the system sifts through dozens of technical indicators, filters for the most relevant ones, and delivers a concise, professional summary explaining what is driving the current price behaviour.
- Broad Coverage: The feature is compatible with virtually every tradable asset class offered on the platform, including major US indices, regional stocks, commodities, and cryptocurrencies, allowing global users to apply the tool across diverse markets.
This launch builds on the firm’s increasing focus on artificial intelligence to serve retail investors. Recent AI-powered releases from Investing.com include:
- WarrenAI: An AI-powered researcher.
- ProPicks AI: A machine-learning strategy engine designed for stock selection.
Investing.com states that this new functionality strengthens its position as a leading platform for active market participants by providing the kind of fast, comprehensive analysis previously only available from a Wall Street analyst.